Option thermal profile#
Thermal map and lines#
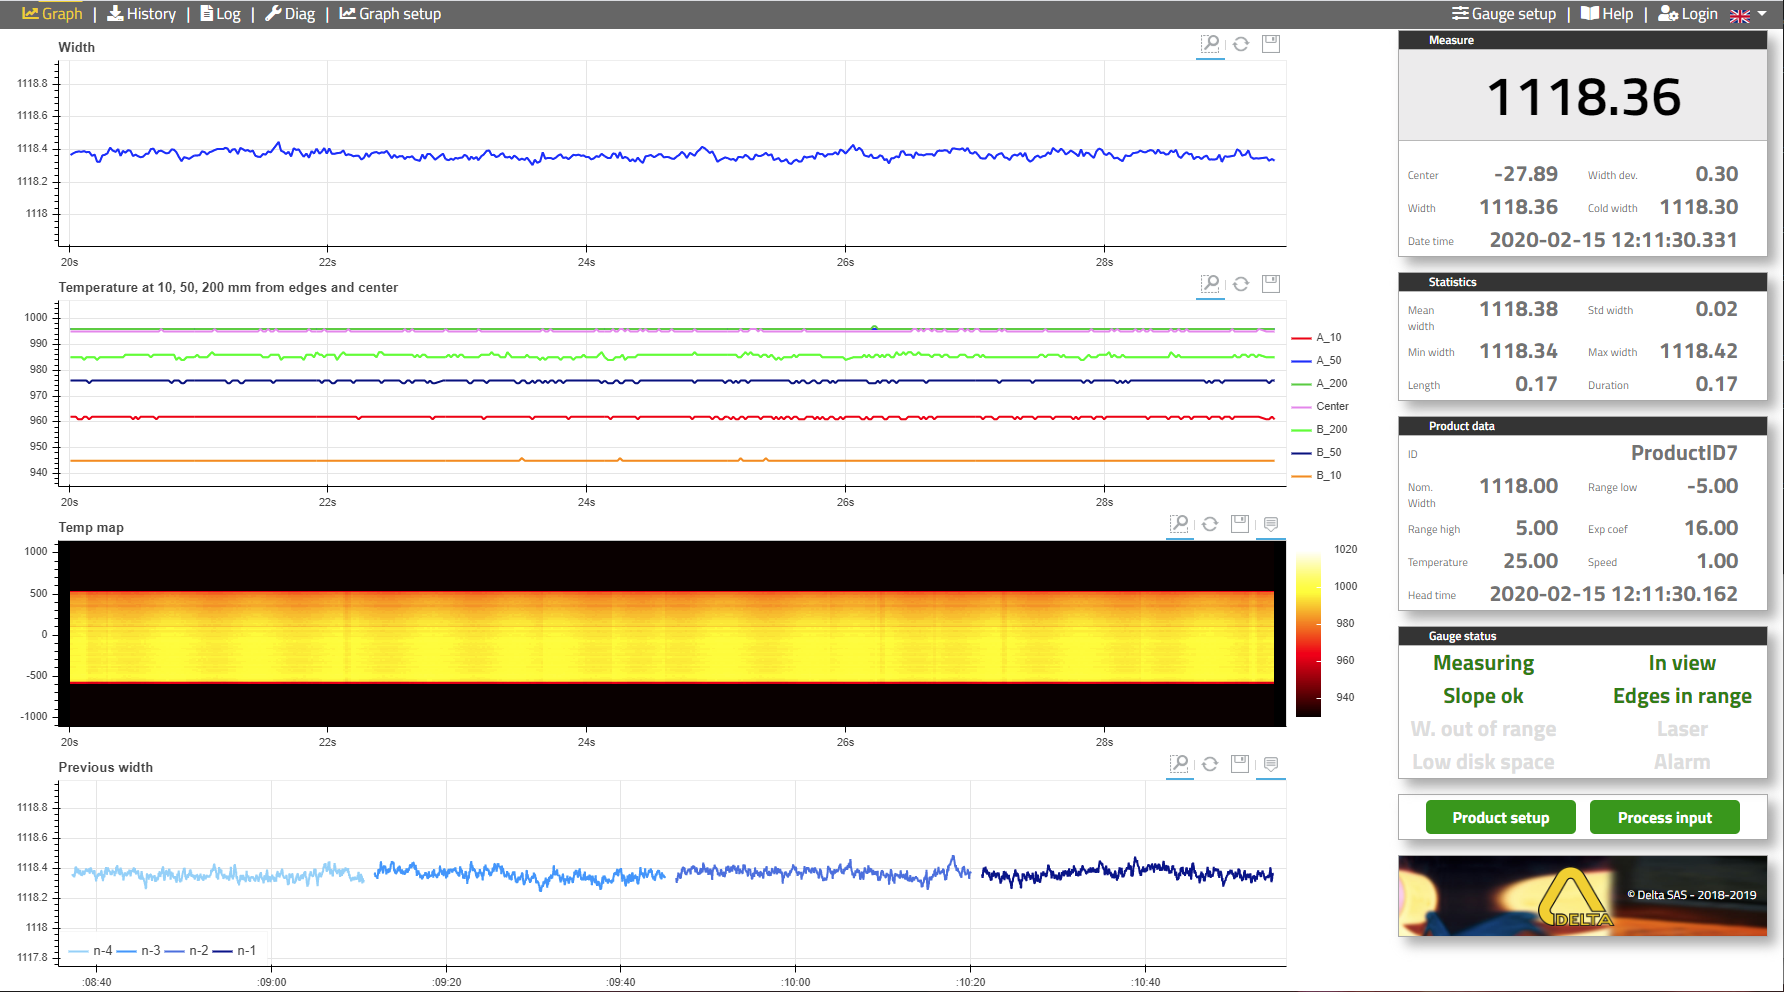
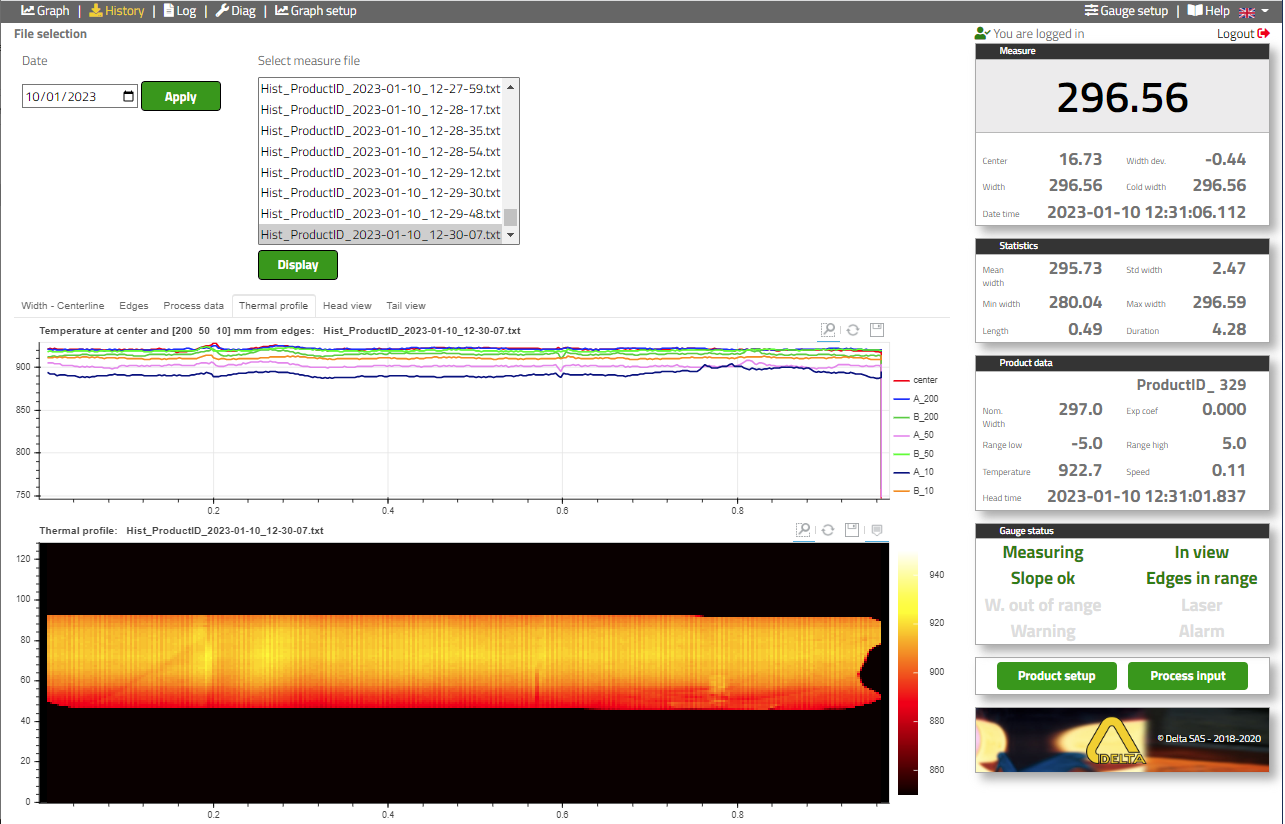
- Typical display with thermal profile option includes:
Temperature graphs: display the strip temperature at the center and at a distance of 10, 50, 200 mm from the edges,
2D temperature map
Graph setup#
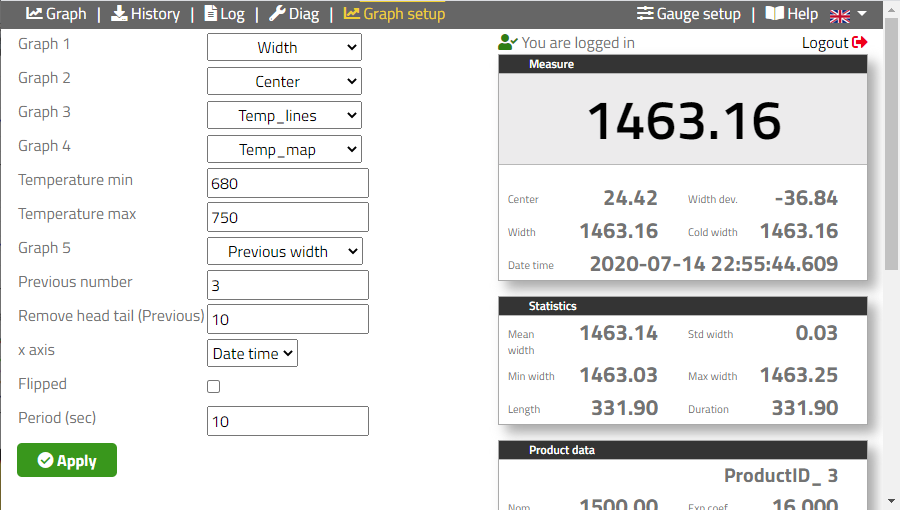
- Menu “Graph setup”
Graph 3 selected to display temperature lines
Graph 4 selected to display 2D temperature map
Scale: set the temperature range of the 2D temperature map in this example: between 680 °C (black) to 750 °C (white),
Gauge setup#
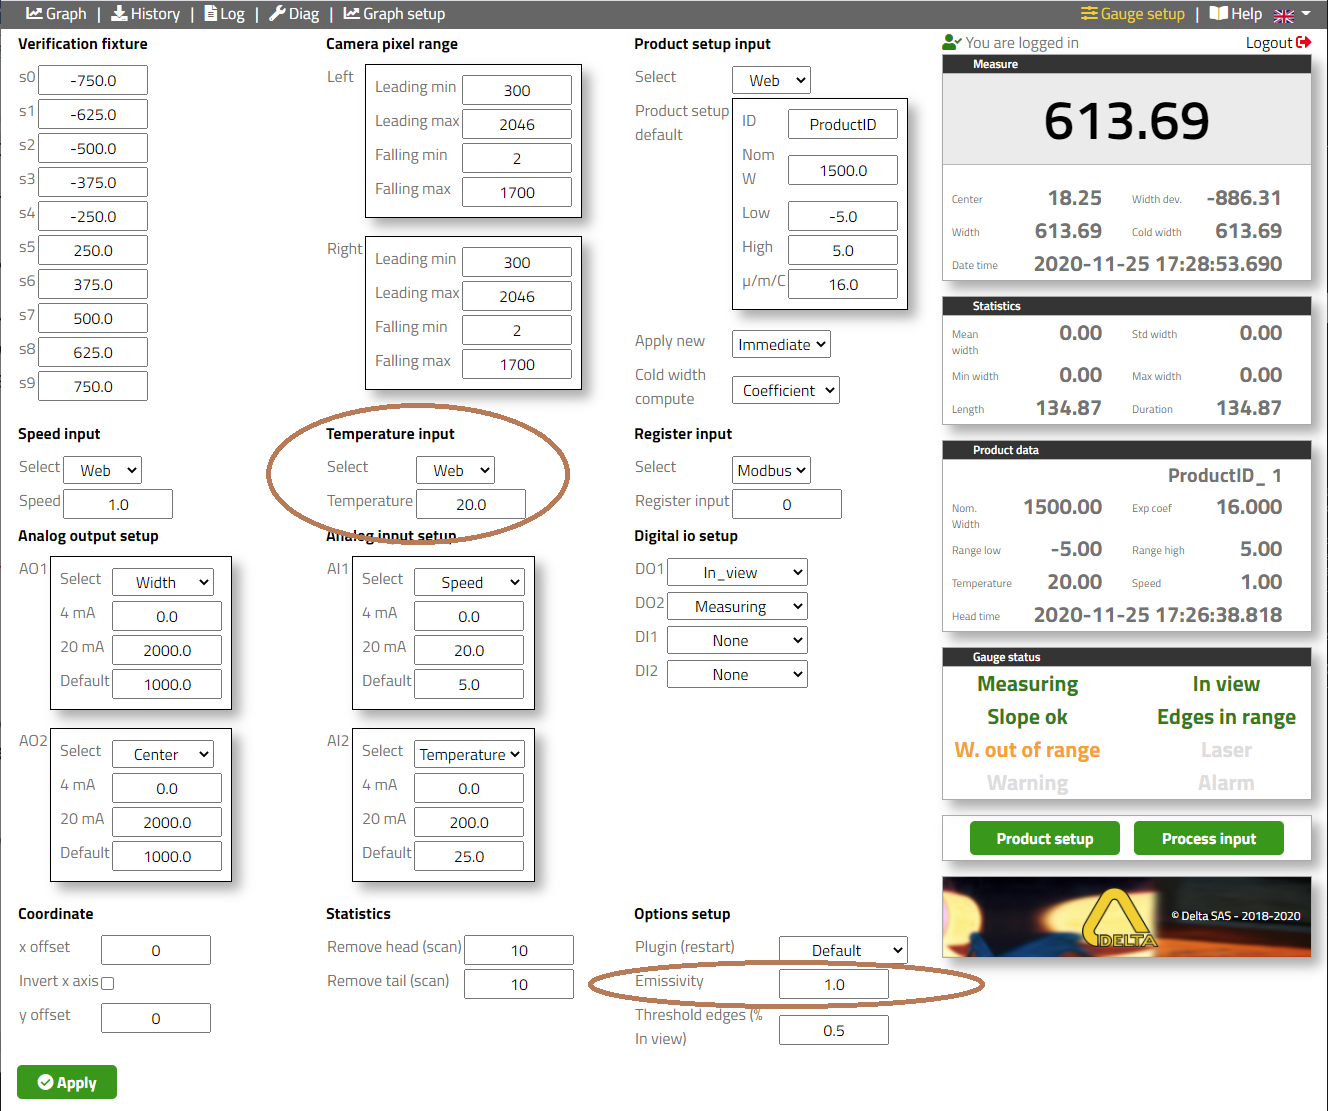
- Menu “Graph setup”
Thermal profile option can be selected for Cold width computation (use of center point).
Emissivity parameter can be set in this menu.
Thermal profile History#