
Diagnostic#
Gauge LED#
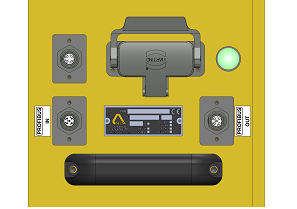
- A Multi color LED displays various status of the Gauge:
During power up of the gauge, the LED is blinking green (1 sec ON, 5 sec OFF) indicating that the power is applied.
When the gauge is initialized and ready, the LED is blinking green (0.7 sec ON, 0.7 sec OFF).
In case of alarm (internal temperature too high), the LED will be blinking red.
If the gauge is powered and the LED is not lighted or does not blink, there is some internal failure.
Camera scans#
Zoom of an edge:
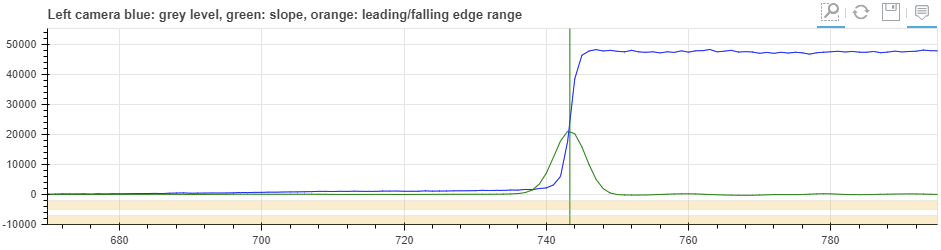
The edge position is determined by the maximum value of the first devivative (slope) or zero crossing of the second derivative.
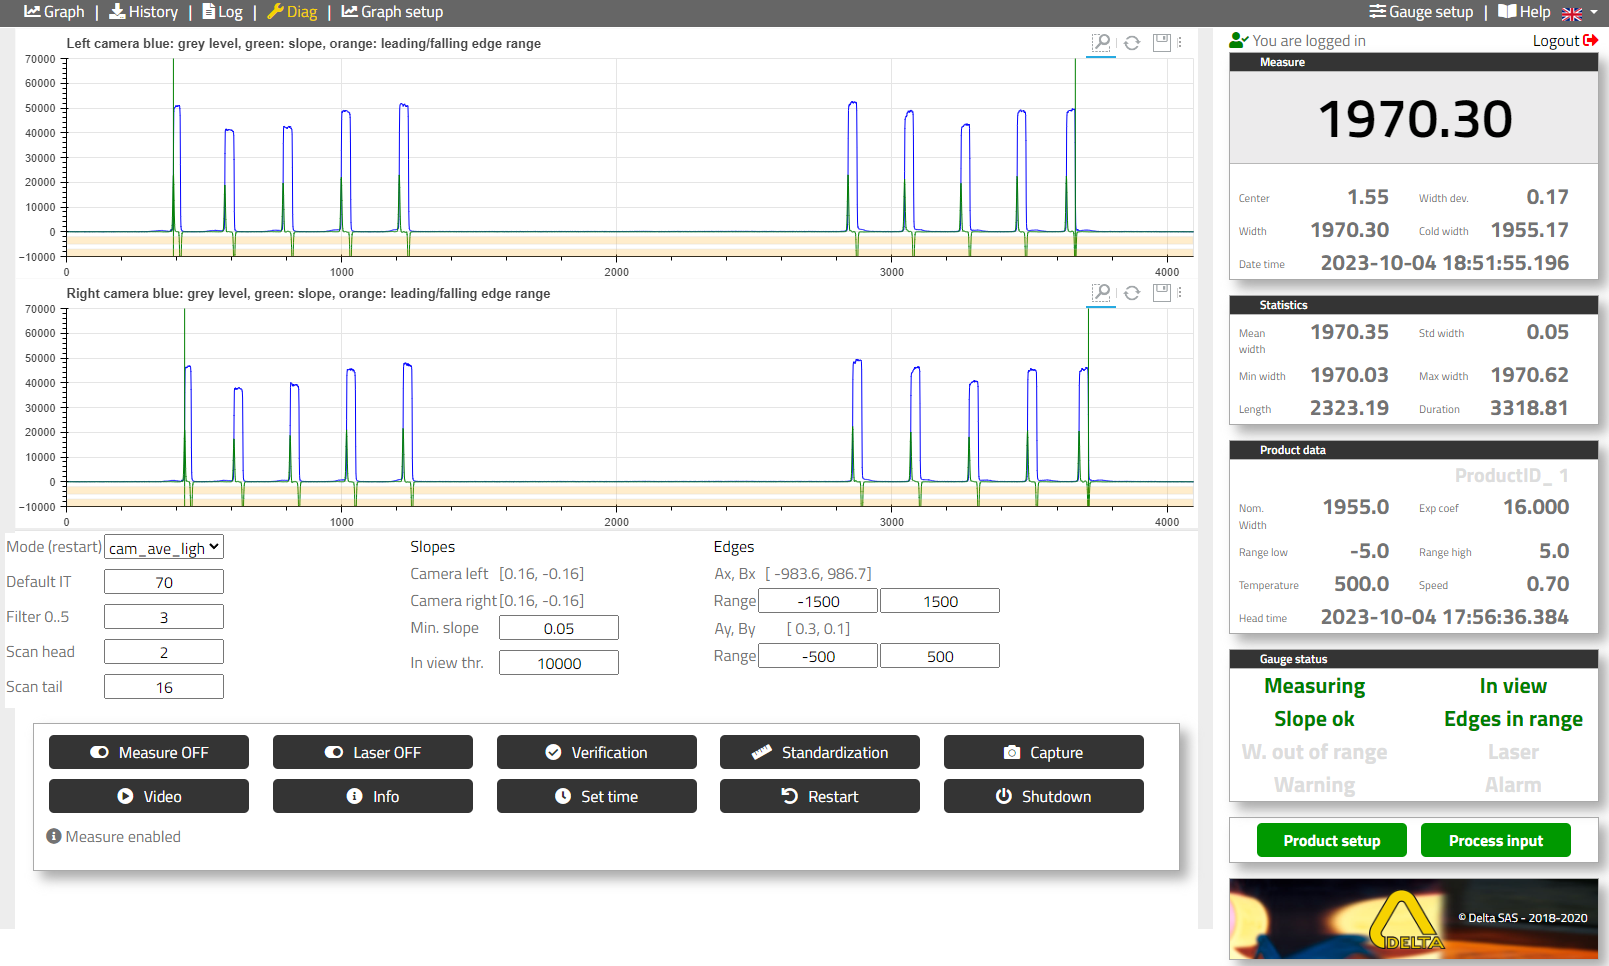
- Left and right camera scans:
Top: camera left
Bottom: camera right
Blue: camera grey level
Green: first derivative
Green vertical lines show the edges position
- Parameters:
Mode: the choices are depending on the XD4100 model. The user has 3 options to select the source: cam_xxx for camera, simu_xxx for simulation and im_xxx for replay of captured images.
Default IT: This parameter is set before shipment. For “light” mode (emission from the strip), it depend on the temperature of the product, For “dark” mode (backlight) no adjustement is necessary.
Filter 0..5: This parameter is set before shipment and can be changed during commissioning for specific conditions.
Scan head: A head is detected when the gauge has several successive scans with good measurements.
Scan tail: A tail is detected when the gauge has several successive scans without measurement.
Min slope: An edge is confirmed if the slope is over this limit. If the slope level is near this limit, “Slope ok” will turn orange (gauge status display).The slope value of each edge is indicated over this parameter. The slope value is the variation of the signal for 1 pixels in percent of the difference between signal and no signal.
In view threshold: the presence of a product is confirmed if there is enough signal difference between maximum and minimum grey level (with filtering). If this gap is close to the detection threshold “In view” will turn orange (gauge status display).
x range, y range, for left and right edges define a windows where the edges should be located. If outside the measurement will be invalid. The data display on top show the current value.
- Action buttons:
Measure on/off: stop/start the measurement.
Laser on/off: for the alignment of the verification fixture (should be off during operation).
Verification: Verification of the accuracy of the gauge with a verification fixture (alignment with the line laser).
Standardization: In case the verification shows an accuracy over the limit, the standardization will automatically recalibrate the gauge.
Capture: save one raw camera data (image) for diagnostic.
Video: real time display of cameras.
Info: display information about the gauge and detail values of all measurements for diagnostic.
Set time: set the gauge date and time to the date of the PC webclient.
Restart: reboot the gauge CPU.
Shutdown: stop the gauge. Before powering off the gauge it is recommanded to “Shutdown” the CPU. Power off/on is required to restart the gauge.
- Measurement status: to start measuring, the gauge needs:
Enough contrast between light and no light. This difference should be over “In view threshold”. If this is the case the status “In view” will be green if there is enough margin and orange if there is a low margin.
To see 2 edges on each camera. An edge is considered valid if the slope is over the “Min slope” parameter. The status “Slope ok” will be green if there is enough margin and orange if the margin is low.
The edges position (mm), should be within a window defined by “x range” and “y range”. If true, the status “Edge in range” will be green.
In normal operation Measuring, In view, Edge ok, Edges in range are green. If there is a low margin for “In view” or “Slope ok” they will turn orange.
- Possible cause for not measuring:
No product: “In view” off,
Slope too low: “Slope ok” off
Edges outside of the window: “Edges in range” off
Command “Measure disable” on: in this case all the 3 status above can be valid, but “Measuring” will be off.
Verification of accuracy and standardization#
A verification bar with 10 slots is placed at the strip level and aligned with a laser line (activated from the diagnostic web page “Laser ON”).
In normal mode, the slot 1 which is the narrower one must be placed on connector side. If The X axis is inverted in the gauge setup menu, the slot 1 must be placed on the opposite connector side.
To start the verification, click “Laser OFF” and click: “Verification”,
If the verification is not within the gauge accuracy, start a standardization, click Standardization,
Make a new verification to confirm the gauge accuracy, click Verification,
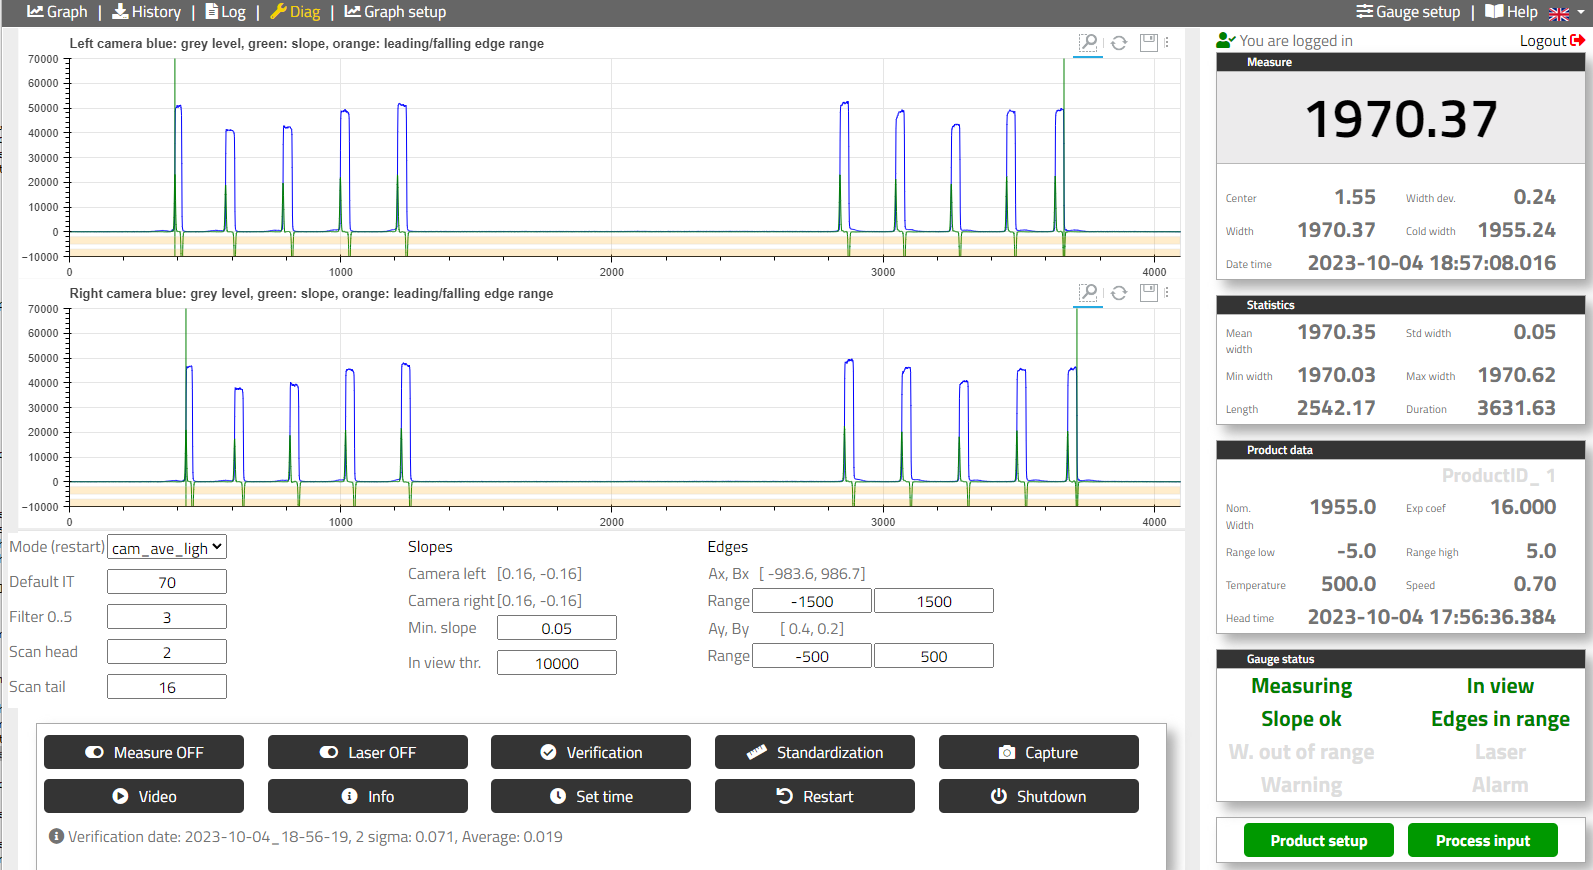
- Note
The verification data are stored in the gauge (folder Verif) and can be access from the Log menu
History and Log records#
Access to files#
History files and Log records can be access through network drive from a Windows Explorer.
- Folder: “\xxx” with xxx gauge IP address or gauge Hostname
Login: user
Password: xd500
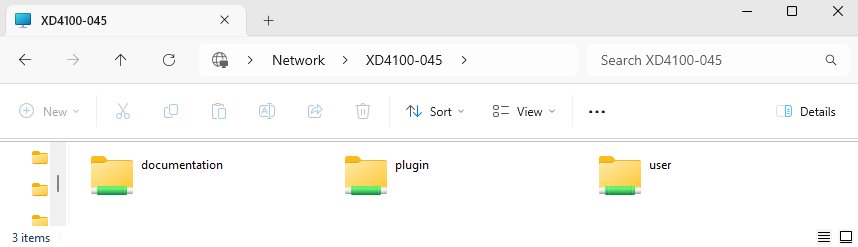
- Gauge folders:
“plugin”: includes the parameters for options and customized features
“user”: includes history and log files
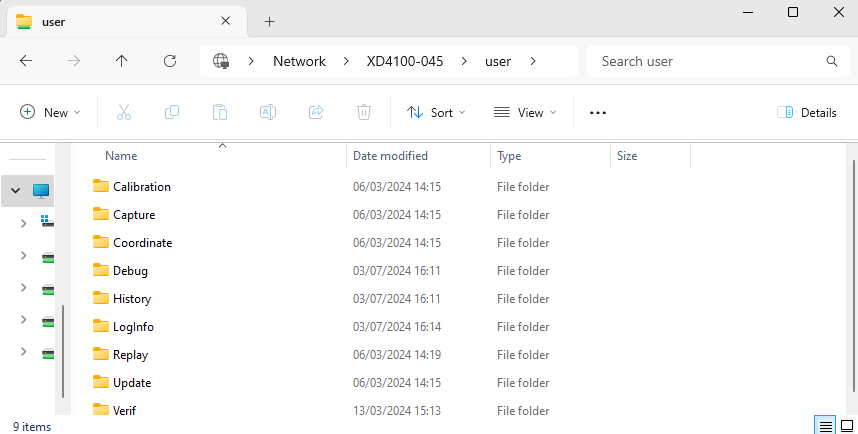
- Files can be retrieved using a PC. The following folders are available:
Capture: images recorded (capture button)
History: history files
LogInfo: Logging files
Replay: Placing a file in this directory and selecting the mode ‘im’, permit to replay the sequence
TempMap: Temperature map (thermal profile option)
Update: Used to update the gauge software
Verif: Records of verification
History menu#
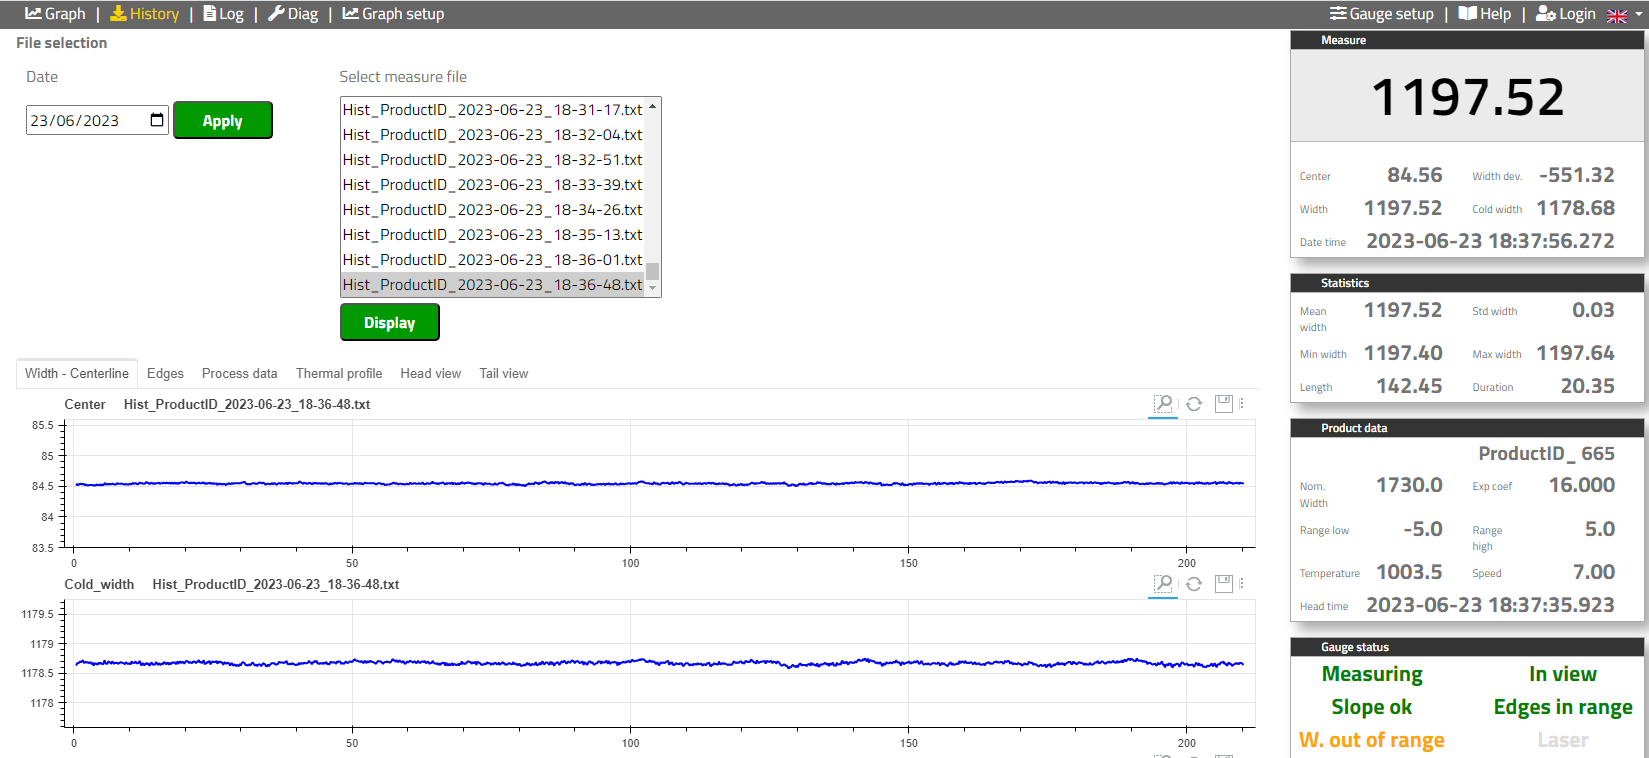
Records of measurement data. Can be replay with the “History” menu and access in the history folder “History”.
- History menu:
- To display history files:
Select the date, click “Apply”
Select the file, click “Display”
Chose the data: “Width-Centerline”, “Edges”, “Process data”
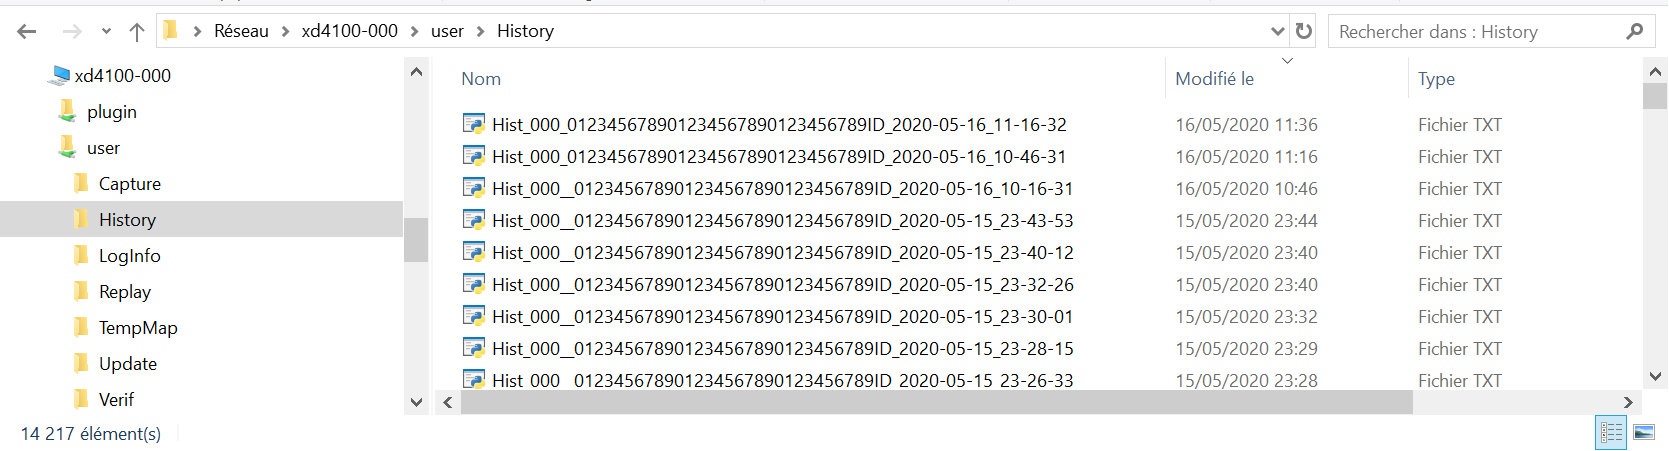
- History files:
Name: Hist_gaugeID_productID_Date_Time.txt, for example: “//xd4100-000/user/History/Hist_000_0123456789ID_2020-05-16_11-16-32.txt”
Format: CSV, with the following columns: ‘Stamp’, ‘Status’, ‘Position’, ‘Width’, ‘Cold_width’, ‘Width_dev’, ‘Center’, ‘Ax’, ‘Bx’, ‘Ay’, ‘By’, ‘Speed’, ‘Temperature’
- Note:
If the gauge disk is near its capacity a warning “Low_disk_space” will be displayed and the gauge will erase automatically history data. If required, the user will record himself the oldest history files.